Data / Chart of the day / Employer firm births in the United States, 2023
Picked on Friday, 23 October 2026 · New series
Employer firm births in the United States, 2023
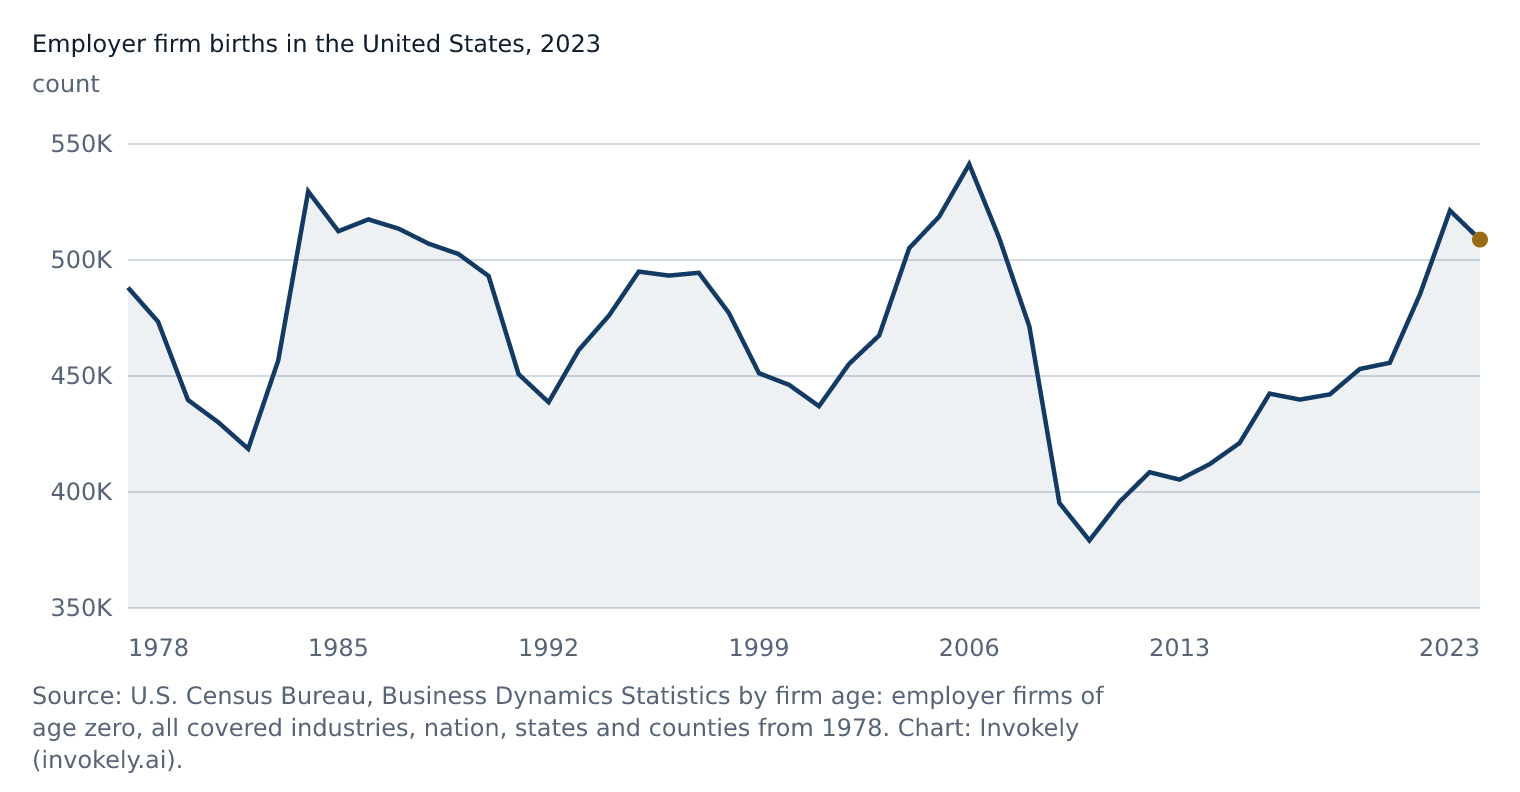
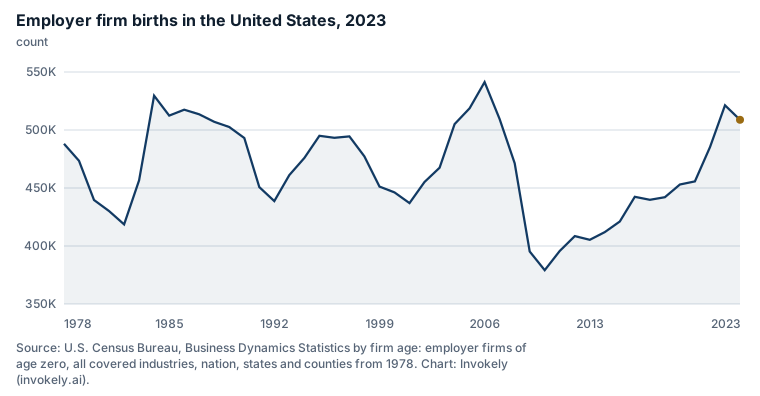
The employer firm births in the United States fell to 508,777 in 2023 from 521,312 in 2022 (-2.4%), according to the U.S. Census Bureau. It is the largest annual fall since 2010. These are the first figures Invokely holds for this series, from 1978 to 2023.
350K 400K 450K 500K 550K 1978 1985 1992 1999 2006 2013 2023 1978: 488,103 count 1979: 473,471 count 1980: 439,667 count 1981: 430,100 count 1982: 418,627 count 1983: 456,610 count 1984: 529,584 count 1985: 512,439 count 1986: 517,516 count 1987: 513,574 count 1988: 507,091 count 1989: 502,558 count 1990: 493,080 count 1991: 450,750 count 1992: 438,701 count 1993: 461,135 count 1994: 475,989 count 1995: 495,030 count 1996: 493,289 count 1997: 494,483 count 1998: 477,206 count 1999: 451,218 count 2000: 446,204 count 2001: 436,993 count 2002: 455,162 count 2003: 467,532 count 2004: 505,056 count 2005: 518,727 count 2006: 541,317 count 2007: 509,517 count 2008: 471,285 count 2009: 395,235 count 2010: 379,145 count 2011: 395,680 count 2012: 408,546 count 2013: 405,350 count 2014: 411,948 count 2015: 421,155 count 2016: 442,414 count 2017: 439,859 count 2018: 442,078 count 2019: 453,027 count 2020: 455,725 count 2021: 485,256 count 2022: 521,312 count 2023: 508,777 count 350K 400K 450K 500K 550K 1978 1994 2010 2023 1978: 488,103 count 1979: 473,471 count 1980: 439,667 count 1981: 430,100 count 1982: 418,627 count 1983: 456,610 count 1984: 529,584 count 1985: 512,439 count 1986: 517,516 count 1987: 513,574 count 1988: 507,091 count 1989: 502,558 count 1990: 493,080 count 1991: 450,750 count 1992: 438,701 count 1993: 461,135 count 1994: 475,989 count 1995: 495,030 count 1996: 493,289 count 1997: 494,483 count 1998: 477,206 count 1999: 451,218 count 2000: 446,204 count 2001: 436,993 count 2002: 455,162 count 2003: 467,532 count 2004: 505,056 count 2005: 518,727 count 2006: 541,317 count 2007: 509,517 count 2008: 471,285 count 2009: 395,235 count 2010: 379,145 count 2011: 395,680 count 2012: 408,546 count 2013: 405,350 count 2014: 411,948 count 2015: 421,155 count 2016: 442,414 count 2017: 439,859 count 2018: 442,078 count 2019: 453,027 count 2020: 455,725 count 2021: 485,256 count 2022: 521,312 count 2023: 508,777 count count. Source: U.S. Census Bureau , Business Dynamics Statistics by firm age: employer firms of age zero, all covered industries, nation, states and counties from 1978 . Retrieved 2026-10-22, published 2025-09-25. Download: PNG image SVG image
2023, count 508,777
Previous, 2022 521,312
Change -2.4%
Reuse Free to reuse with credit to U.S. Census Bureau as the source and a link to this page on Invokely. Terms for the figures: Public domain (US federal government work, citation requested). https://www.census.gov/about/policies/citation.html
How to cite U.S. Census Bureau. Business Dynamics Statistics by firm age: employer firms of age zero, all covered industries, nation, states and counties from 1978. https://www2.census.gov/programs-surveys/bds/tables/time-series/2023/bds2023_fa.csv. Retrieved 2026-10-22.Embed this chart Paste this code into a web page. It shows the chart as an image with the source credit and a link to this page.
Embed code Share
More charts from Friday, 23 October 2026 New series
The disposable income per person (CSO county incomes) in Ireland rose to €30,139 in 2024 from €27,986 in 2023 (+7.7%), according to the Central Statistics Office (Ireland). It is the highest value in the series since 2000. These are the first figures Invokely holds for this series, from 2000 to 2024.
10K 15K 20K 25K 30K 35K 2000 2004 2008 2012 2016 2020 2024 2000: 12,549 EUR 2001: 14,205 EUR 2002: 14,972 EUR 2003: 15,795 EUR 2004: 16,591 EUR 2005: 17,744 EUR 2006: 18,488 EUR 2007: 19,615 EUR 2008: 20,774 EUR 2009: 19,319 EUR 2010: 18,114 EUR 2011: 17,874 EUR 2012: 18,260 EUR 2013: 18,205 EUR 2014: 18,250 EUR 2015: 19,186 EUR 2016: 19,918 EUR 2017: 20,950 EUR 2018: 21,477 EUR 2019: 22,713 EUR 2020: 23,553 EUR 2021: 24,470 EUR 2022: 25,698 EUR 2023: 27,986 EUR 2024: 30,139 EUR 10K 15K 20K 25K 30K 35K 2000 2009 2024 2000: 12,549 EUR 2001: 14,205 EUR 2002: 14,972 EUR 2003: 15,795 EUR 2004: 16,591 EUR 2005: 17,744 EUR 2006: 18,488 EUR 2007: 19,615 EUR 2008: 20,774 EUR 2009: 19,319 EUR 2010: 18,114 EUR 2011: 17,874 EUR 2012: 18,260 EUR 2013: 18,205 EUR 2014: 18,250 EUR 2015: 19,186 EUR 2016: 19,918 EUR 2017: 20,950 EUR 2018: 21,477 EUR 2019: 22,713 EUR 2020: 23,553 EUR 2021: 24,470 EUR 2022: 25,698 EUR 2023: 27,986 EUR 2024: 30,139 EUR Source: Central Statistics Office.
New series
The 12-month Euribor in Euro area rose to 3.247% in September 2026 from 2.954% in August 2026 (+0.29 pts), according to the European Central Bank. It is the largest monthly rise since March 2026. These are the first figures Invokely holds for this series, from January 1999 to September 2026.
-1 0 1 2 3 4 5 2021-10 2022-07 2023-04 2024-01 2024-10 2025-07 2026-09 2021-10: -0.477 % 2021-11: -0.487 % 2021-12: -0.502 % 2022-01: -0.477 % 2022-02: -0.335 % 2022-03: -0.237 % 2022-04: 0.013 % 2022-05: 0.287 % 2022-06: 0.852 % 2022-07: 0.992 % 2022-08: 1.249 % 2022-09: 2.233 % 2022-10: 2.629 % 2022-11: 2.828 % 2022-12: 3.018 % 2023-01: 3.337 % 2023-02: 3.534 % 2023-03: 3.647 % 2023-04: 3.757 % 2023-05: 3.862 % 2023-06: 4.007 % 2023-07: 4.149 % 2023-08: 4.073 % 2023-09: 4.149 % 2023-10: 4.16 % 2023-11: 4.022 % 2023-12: 3.679 % 2024-01: 3.609 % 2024-02: 3.671 % 2024-03: 3.718 % 2024-04: 3.703 % 2024-05: 3.68 % 2024-06: 3.65 % 2024-07: 3.526 % 2024-08: 3.166 % 2024-09: 2.936 % 2024-10: 2.691 % 2024-11: 2.506 % 2024-12: 2.436 % 2025-01: 2.525 % 2025-02: 2.407 % 2025-03: 2.398 % 2025-04: 2.143 % 2025-05: 2.081 % 2025-06: 2.081 % 2025-07: 2.079 % 2025-08: 2.114 % 2025-09: 2.172 % 2025-10: 2.187 % 2025-11: 2.217 % 2025-12: 2.267 % 2026-01: 2.245 % 2026-02: 2.221 % 2026-03: 2.565 % 2026-04: 2.747 % 2026-05: 2.804 % 2026-06: 2.798 % 2026-07: 2.855 % 2026-08: 2.954 % 2026-09: 3.247 % -2 0 2 4 6 2021-10 2023-06 2025-02 2026-09 2021-10: -0.477 % 2021-11: -0.487 % 2021-12: -0.502 % 2022-01: -0.477 % 2022-02: -0.335 % 2022-03: -0.237 % 2022-04: 0.013 % 2022-05: 0.287 % 2022-06: 0.852 % 2022-07: 0.992 % 2022-08: 1.249 % 2022-09: 2.233 % 2022-10: 2.629 % 2022-11: 2.828 % 2022-12: 3.018 % 2023-01: 3.337 % 2023-02: 3.534 % 2023-03: 3.647 % 2023-04: 3.757 % 2023-05: 3.862 % 2023-06: 4.007 % 2023-07: 4.149 % 2023-08: 4.073 % 2023-09: 4.149 % 2023-10: 4.16 % 2023-11: 4.022 % 2023-12: 3.679 % 2024-01: 3.609 % 2024-02: 3.671 % 2024-03: 3.718 % 2024-04: 3.703 % 2024-05: 3.68 % 2024-06: 3.65 % 2024-07: 3.526 % 2024-08: 3.166 % 2024-09: 2.936 % 2024-10: 2.691 % 2024-11: 2.506 % 2024-12: 2.436 % 2025-01: 2.525 % 2025-02: 2.407 % 2025-03: 2.398 % 2025-04: 2.143 % 2025-05: 2.081 % 2025-06: 2.081 % 2025-07: 2.079 % 2025-08: 2.114 % 2025-09: 2.172 % 2025-10: 2.187 % 2025-11: 2.217 % 2025-12: 2.267 % 2026-01: 2.245 % 2026-02: 2.221 % 2026-03: 2.565 % 2026-04: 2.747 % 2026-05: 2.804 % 2026-06: 2.798 % 2026-07: 2.855 % 2026-08: 2.954 % 2026-09: 3.247 % Source: ECB.