Data / Chart of the day / Wind electricity generation in the United States, 2025
Picked on Monday, 12 October 2026 · New series
Wind electricity generation in the United States, 2025
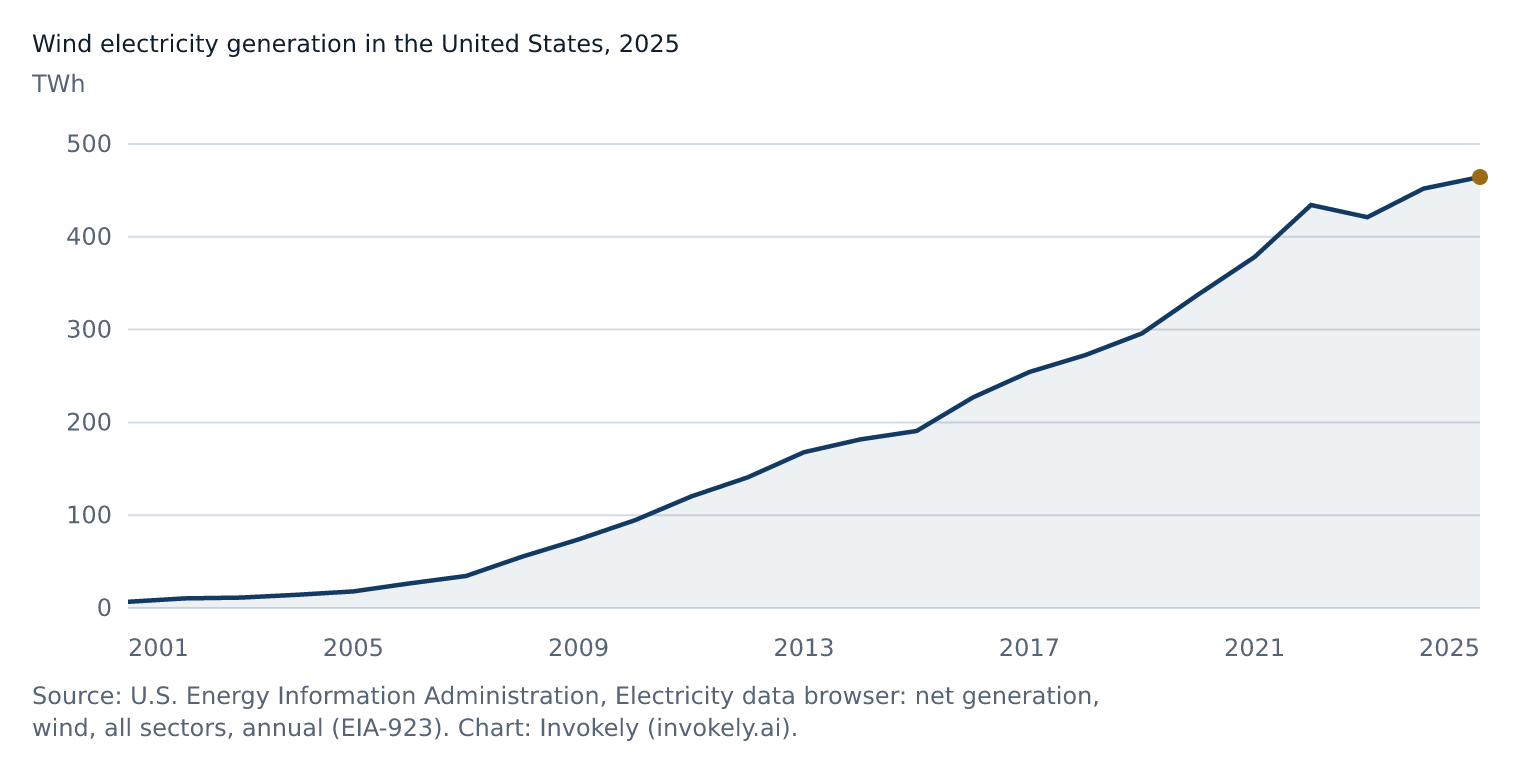
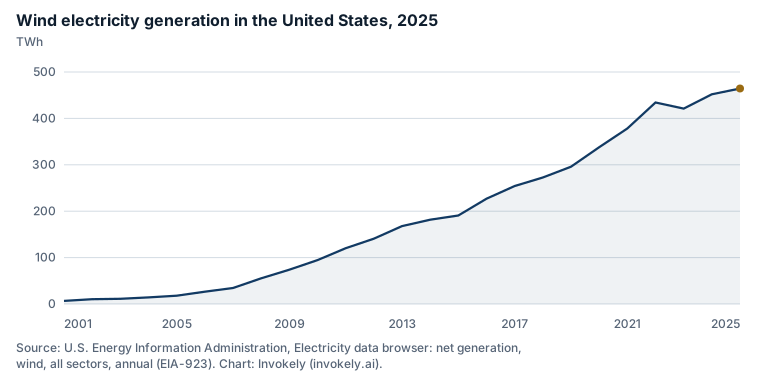
The wind electricity generation in the United States rose to 464.39 TWh in 2025 from 451.9 TWh in 2024 (+2.8%), according to the U.S. Energy Information Administration. It is the highest value in the series since 2001. These are the first figures Invokely holds for this series, from 2001 to 2025.
0 100 200 300 400 500 2001 2005 2009 2013 2017 2021 2025 2001: 6.74 TWh 2002: 10.35 TWh 2003: 11.19 TWh 2004: 14.14 TWh 2005: 17.81 TWh 2006: 26.59 TWh 2007: 34.45 TWh 2008: 55.36 TWh 2009: 73.89 TWh 2010: 94.65 TWh 2011: 120.18 TWh 2012: 140.82 TWh 2013: 167.84 TWh 2014: 181.66 TWh 2015: 190.72 TWh 2016: 226.99 TWh 2017: 254.3 TWh 2018: 272.67 TWh 2019: 295.88 TWh 2020: 337.94 TWh 2021: 378.2 TWh 2022: 434.3 TWh 2023: 421.14 TWh 2024: 451.9 TWh 2025: 464.39 TWh 0 200 400 600 2001 2010 2025 2001: 6.74 TWh 2002: 10.35 TWh 2003: 11.19 TWh 2004: 14.14 TWh 2005: 17.81 TWh 2006: 26.59 TWh 2007: 34.45 TWh 2008: 55.36 TWh 2009: 73.89 TWh 2010: 94.65 TWh 2011: 120.18 TWh 2012: 140.82 TWh 2013: 167.84 TWh 2014: 181.66 TWh 2015: 190.72 TWh 2016: 226.99 TWh 2017: 254.3 TWh 2018: 272.67 TWh 2019: 295.88 TWh 2020: 337.94 TWh 2021: 378.2 TWh 2022: 434.3 TWh 2023: 421.14 TWh 2024: 451.9 TWh 2025: 464.39 TWh TWh. Source: EIA , Electricity data browser: net generation, wind, all sectors, annual (EIA-923) . Retrieved 2026-10-11, published 2026-10-11. Download: PNG image SVG image
2025, TWh 464.39
Previous, 2024 451.9
Change +2.8%
Reuse Free to reuse with credit to U.S. Energy Information Administration as the source and a link to this page on Invokely. Terms for the figures: Public domain (US federal government work, attribution requested). https://www.eia.gov/about/copyrights_reuse.php
How to cite Source: U.S. Energy Information Administration. Electricity data browser: net generation, wind, all sectors, annual (EIA-923). Retrieved through Data Commons (datacommons.org). https://www.eia.gov/electricity/data/browser/. Retrieved 2026-10-11.Embed this chart Paste this code into a web page. It shows the chart as an image with the source credit and a link to this page.
Embed code Share
More charts from Monday, 12 October 2026 New series
The consumers price index (June 2017 quarter = 1,000) in New Zealand rose to 1,359 in Q2 2026 from 1,339 in Q1 2026 (+20), according to Stats NZ Tatauranga Aotearoa. It is the highest value in the series since Q1 1950. These are the first figures Invokely holds for this series, from Q1 1950 to Q2 2026.
900 1,000 1,100 1,200 1,300 1,400 2011-Q3 2013-Q4 2016-Q1 2018-Q2 2020-Q3 2022-Q4 2026-Q2 2011-Q3: 948 index 2011-Q4: 945 index 2012-Q1: 949 index 2012-Q2: 953 index 2012-Q3: 955 index 2012-Q4: 954 index 2013-Q1: 958 index 2013-Q2: 959 index 2013-Q3: 968 index 2013-Q4: 969 index 2014-Q1: 972 index 2014-Q2: 975 index 2014-Q3: 978 index 2014-Q4: 976 index 2015-Q1: 975 index 2015-Q2: 979 index 2015-Q3: 982 index 2015-Q4: 977 index 2016-Q1: 979 index 2016-Q2: 983 index 2016-Q3: 986 index 2016-Q4: 990 index 2017-Q1: 1,000 index 2017-Q2: 1,000 index 2017-Q3: 1,005 index 2017-Q4: 1,006 index 2018-Q1: 1,011 index 2018-Q2: 1,015 index 2018-Q3: 1,024 index 2018-Q4: 1,025 index 2019-Q1: 1,026 index 2019-Q2: 1,032 index 2019-Q3: 1,039 index 2019-Q4: 1,044 index 2020-Q1: 1,052 index 2020-Q2: 1,047 index 2020-Q3: 1,054 index 2020-Q4: 1,059 index 2021-Q1: 1,068 index 2021-Q2: 1,082 index 2021-Q3: 1,106 index 2021-Q4: 1,122 index 2022-Q1: 1,142 index 2022-Q2: 1,161 index 2022-Q3: 1,186 index 2022-Q4: 1,203 index 2023-Q1: 1,218 index 2023-Q2: 1,231 index 2023-Q3: 1,253 index 2023-Q4: 1,259 index 2024-Q1: 1,267 index 2024-Q2: 1,272 index 2024-Q3: 1,280 index 2024-Q4: 1,287 index 2025-Q1: 1,299 index 2025-Q2: 1,306 index 2025-Q3: 1,319 index 2025-Q4: 1,327 index 2026-Q1: 1,339 index 2026-Q2: 1,359 index 800 1,000 1,200 1,400 2011-Q3 2016-Q3 2021-Q3 2026-Q2 2011-Q3: 948 index 2011-Q4: 945 index 2012-Q1: 949 index 2012-Q2: 953 index 2012-Q3: 955 index 2012-Q4: 954 index 2013-Q1: 958 index 2013-Q2: 959 index 2013-Q3: 968 index 2013-Q4: 969 index 2014-Q1: 972 index 2014-Q2: 975 index 2014-Q3: 978 index 2014-Q4: 976 index 2015-Q1: 975 index 2015-Q2: 979 index 2015-Q3: 982 index 2015-Q4: 977 index 2016-Q1: 979 index 2016-Q2: 983 index 2016-Q3: 986 index 2016-Q4: 990 index 2017-Q1: 1,000 index 2017-Q2: 1,000 index 2017-Q3: 1,005 index 2017-Q4: 1,006 index 2018-Q1: 1,011 index 2018-Q2: 1,015 index 2018-Q3: 1,024 index 2018-Q4: 1,025 index 2019-Q1: 1,026 index 2019-Q2: 1,032 index 2019-Q3: 1,039 index 2019-Q4: 1,044 index 2020-Q1: 1,052 index 2020-Q2: 1,047 index 2020-Q3: 1,054 index 2020-Q4: 1,059 index 2021-Q1: 1,068 index 2021-Q2: 1,082 index 2021-Q3: 1,106 index 2021-Q4: 1,122 index 2022-Q1: 1,142 index 2022-Q2: 1,161 index 2022-Q3: 1,186 index 2022-Q4: 1,203 index 2023-Q1: 1,218 index 2023-Q2: 1,231 index 2023-Q3: 1,253 index 2023-Q4: 1,259 index 2024-Q1: 1,267 index 2024-Q2: 1,272 index 2024-Q3: 1,280 index 2024-Q4: 1,287 index 2025-Q1: 1,299 index 2025-Q2: 1,306 index 2025-Q3: 1,319 index 2025-Q4: 1,327 index 2026-Q1: 1,339 index 2026-Q2: 1,359 index Source: Stats NZ.
New series
The population on 31 December in Sweden rose to 10.61 million in 2025 from 10.59 million in 2024 (+0.2%), according to Statistics Sweden (Statistiska centralbyrån, SCB). It is the highest value in the series since 1991. These are the first figures Invokely holds for this series, from 1991 to 2025.
8.5M 9M 9.5M 10M 10.5M 11M 1991 1996 2001 2006 2011 2016 2021 2025 1991: 8,644,119 persons 1992: 8,692,013 persons 1993: 8,745,109 persons 1994: 8,816,381 persons 1995: 8,837,496 persons 1996: 8,844,499 persons 1997: 8,847,625 persons 1998: 8,854,322 persons 1999: 8,861,426 persons 2000: 8,882,792 persons 2001: 8,909,128 persons 2002: 8,940,788 persons 2003: 8,975,670 persons 2004: 9,011,392 persons 2005: 9,047,752 persons 2006: 9,113,257 persons 2007: 9,182,927 persons 2008: 9,256,347 persons 2009: 9,340,682 persons 2010: 9,415,570 persons 2011: 9,482,855 persons 2012: 9,555,893 persons 2013: 9,644,864 persons 2014: 9,747,355 persons 2015: 9,851,017 persons 2016: 9,995,153 persons 2017: 10,120,242 persons 2018: 10,230,185 persons 2019: 10,327,589 persons 2020: 10,379,295 persons 2021: 10,452,326 persons 2022: 10,521,556 persons 2023: 10,551,707 persons 2024: 10,587,710 persons 2025: 10,605,529 persons 8.5M 9M 9.5M 10M 10.5M 11M 1991 2003 2015 2025 1991: 8,644,119 persons 1992: 8,692,013 persons 1993: 8,745,109 persons 1994: 8,816,381 persons 1995: 8,837,496 persons 1996: 8,844,499 persons 1997: 8,847,625 persons 1998: 8,854,322 persons 1999: 8,861,426 persons 2000: 8,882,792 persons 2001: 8,909,128 persons 2002: 8,940,788 persons 2003: 8,975,670 persons 2004: 9,011,392 persons 2005: 9,047,752 persons 2006: 9,113,257 persons 2007: 9,182,927 persons 2008: 9,256,347 persons 2009: 9,340,682 persons 2010: 9,415,570 persons 2011: 9,482,855 persons 2012: 9,555,893 persons 2013: 9,644,864 persons 2014: 9,747,355 persons 2015: 9,851,017 persons 2016: 9,995,153 persons 2017: 10,120,242 persons 2018: 10,230,185 persons 2019: 10,327,589 persons 2020: 10,379,295 persons 2021: 10,452,326 persons 2022: 10,521,556 persons 2023: 10,551,707 persons 2024: 10,587,710 persons 2025: 10,605,529 persons Source: Statistics Sweden.