Data / Chart of the day / Household disposable income per inhabitant in the European Union (27), 2023
· New series
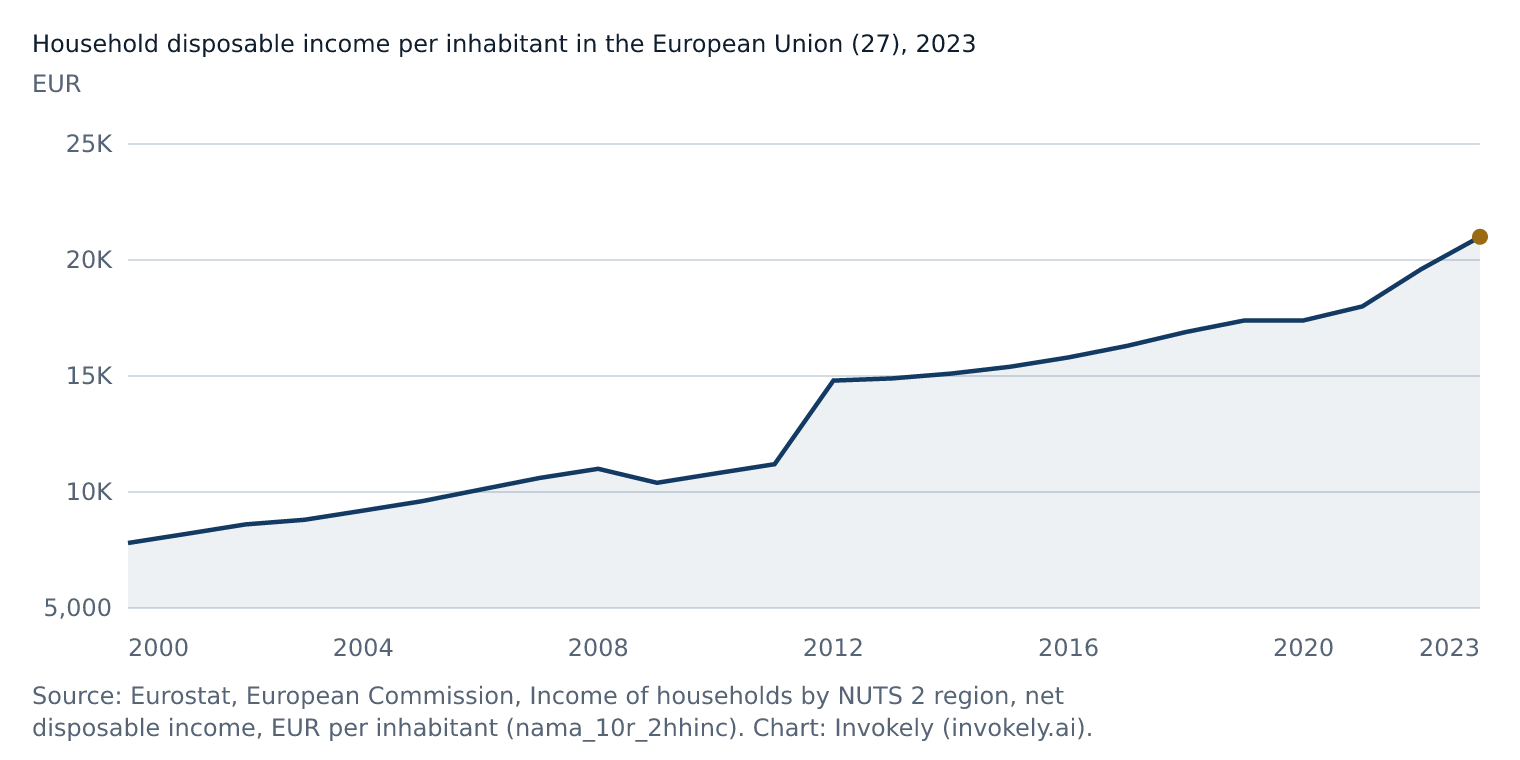
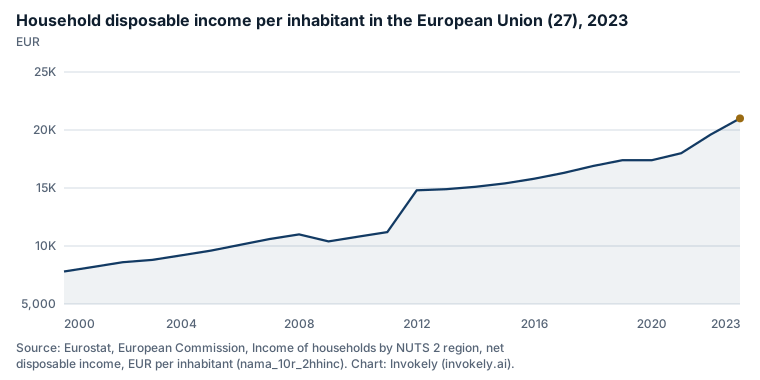
Household disposable income per inhabitant in the European Union (27), 2023
The household disposable income per inhabitant in the European Union (27) rose to €21,000 in 2023 from €19,600 in 2022 (+7.1%), according to Eurostat, European Commission. It is the highest value in the series since 2000. These are the first figures Invokely holds for this series, from 2000 to 2023.
Free to reuse with credit to Eurostat, European Commission as the source and a link to this page on Invokely. Terms for the figures: Eurostat reuse policy (commercial and non-commercial reuse, attribution required). https://ec.europa.eu/eurostat/help/copyright-notice
How to cite
Eurostat. Income of households by NUTS 2 region, net disposable income, EUR per inhabitant (nama_10r_2hhinc). https://ec.europa.eu/eurostat/databrowser/view/nama_10r_2hhinc/default/table. Retrieved 2026-10-09.
Embed this chart
Paste this code into a web page. It shows the chart as an image with the source credit and a link to this page.
The household disposable income per inhabitant in PPS in the European Union (27) rose to 21,000 PPS in 2023 from 19,600 PPS in 2022 (+7.1%), according to Eurostat, European Commission. It is the highest value in the series since 2000. These are the first figures Invokely holds for this series, from 2000 to 2023.
The per capita personal income in the United States rose to $77,028 in 2025 from $73,634 in 2024 (+4.6%), according to the U.S. Bureau of Economic Analysis. It is the highest value in the series since 1929. These are the first figures Invokely holds for this series, from 1929 to 2025.