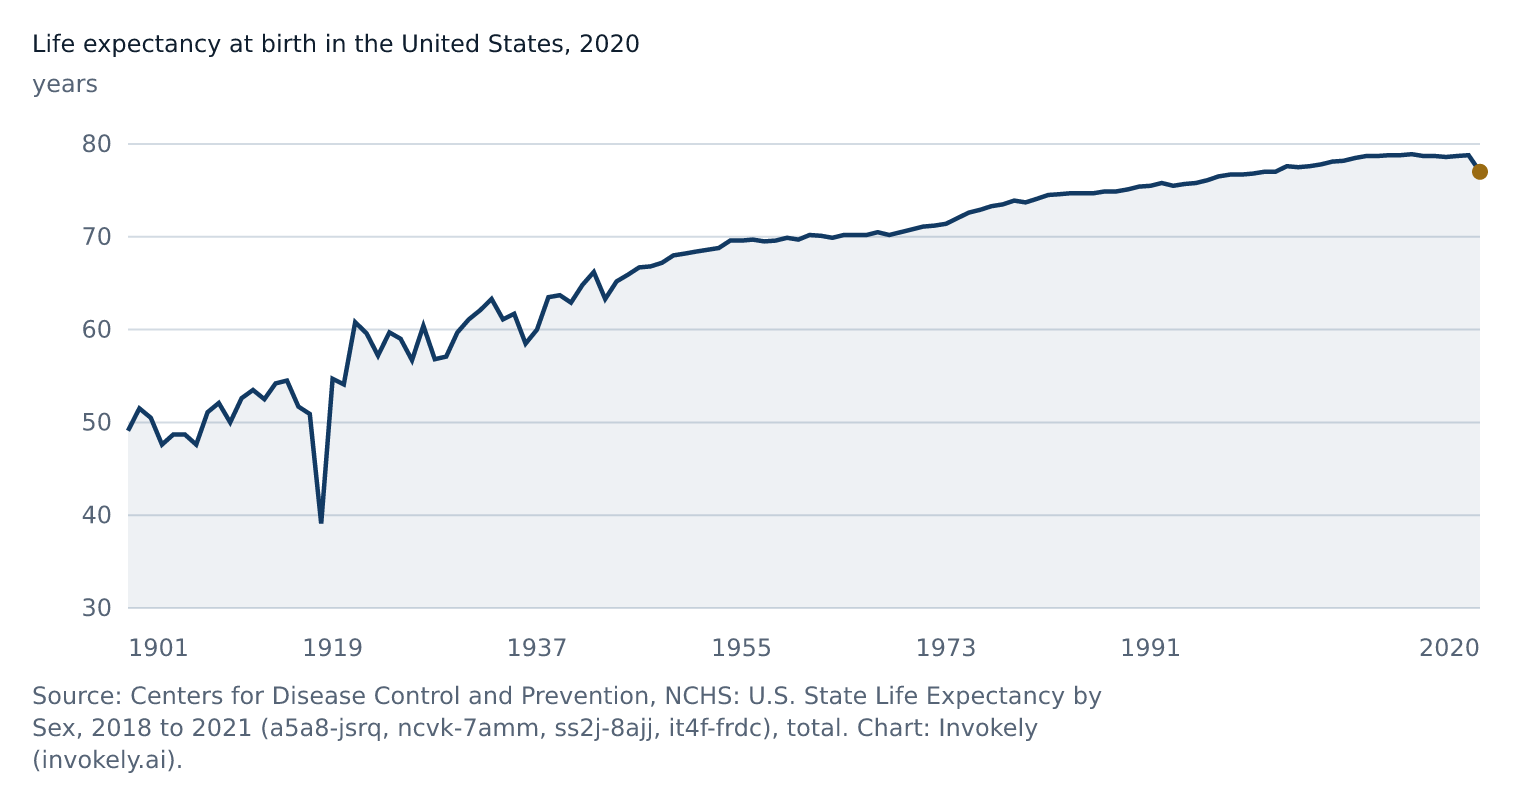
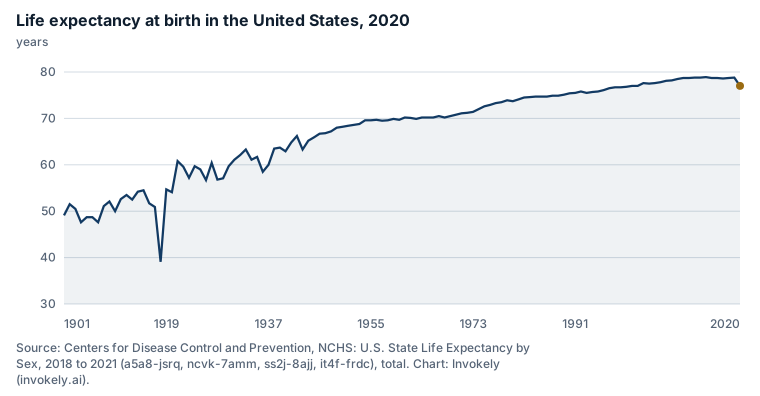
Life expectancy at birth in the United States, 2020
The life expectancy in the United States fell to 77 years in 2020 from 78.8 years in 2019 (-1.8), according to the Centers for Disease Control and Prevention. It is the largest annual fall since 1943. These are the first figures Invokely holds for this series, from 1900 to 2020.
Reuse
Free to reuse with credit to Centers for Disease Control and Prevention as the source and a link to this page on Invokely. Terms for the figures: Public domain US government data; attribution, free-availability notice and non-endorsement disclaimer required; substantive content unchanged. https://www.cdc.gov/other/agencymaterials.html
How to cite
Centers for Disease Control and Prevention (CDC). NCHS: U.S. State Life Expectancy by Sex, 2018 to 2021 (a5a8-jsrq, ncvk-7amm, ss2j-8ajj, it4f-frdc), total. https://www.cdc.gov/nchs/nvss/life-expectancy.htm. Retrieved 2026-10-09. These data are available free from CDC. Use does not imply endorsement by CDC, ATSDR, HHS or the United States Government.Share
More charts from Saturday, 10 October 2026
-
Internet use in the last 3 months in the European Union (27), 2025
The share of people using the internet in the European Union (27) rose to 93.8% in 2025 from 92.8% in 2024 (+1 pts), according to Eurostat, European Commission. It is the highest value in the series since 2007. These are the first figures Invokely holds for this series, from 2007 to 2025.
-
House price index, 2015 = 100 in the European Union (27), Q2 2026
The house price index, 2015 = 100 in the European Union (27) rose to 168.56 in Q2 2026 from 166.51 in Q1 2026 (+2.05), according to Eurostat, European Commission. It is the highest value in the series since Q1 2005. These are the first figures Invokely holds for this series, from Q1 2005 to Q2 2026.